Kanban: Definition, 6 Rules, and its Benefits
Kanban is a crucial part of the Just in Time (JIT) system, which we discussed…
Sean Thobias
May 17, 2025Value Stream Mapping (VSM) supports the formation of Just-in-Time, as explained in the previous chapter. By implementing VSM, you can visualize, analyze, and improve all steps in product delivery.
In today’s saturated market conditions, it’s challenging to convince customers. Therefore, it is crucial to provide the value they need.
VSM is a strategy to enhance excellence and create the value customers seek. Let’s dive into the definition, process, and objectives of Value Stream Mapping.
Value Stream Mapping (VSM) is a helpful tool for understanding your company’s current state and finding ways to improve. It shows you a detailed picture of every step in your work process, from getting supplies to delivering products or services to customers.
VSM covers all the essential steps to provide value, giving customers what they want to pay for. For example, a software company’s value comes from its software solution and its features.
It’s worth noting that not all work processes directly give value to customers. Some procedures, like quality control, don’t require customers to pay extra. However, without quality control, the product or service’s quality would suffer, and it wouldn’t match what customers want.
So, even though it doesn’t directly bring in money, quality control helps ensure that the final product or service has the value customers expect.
Read more: Lean Manufacturing: Definition & 3 Advantages to Utilize
Various industries like banking, healthcare, and insurance implement VSM. The symbols depicted in the figure below represent the components of VSM.
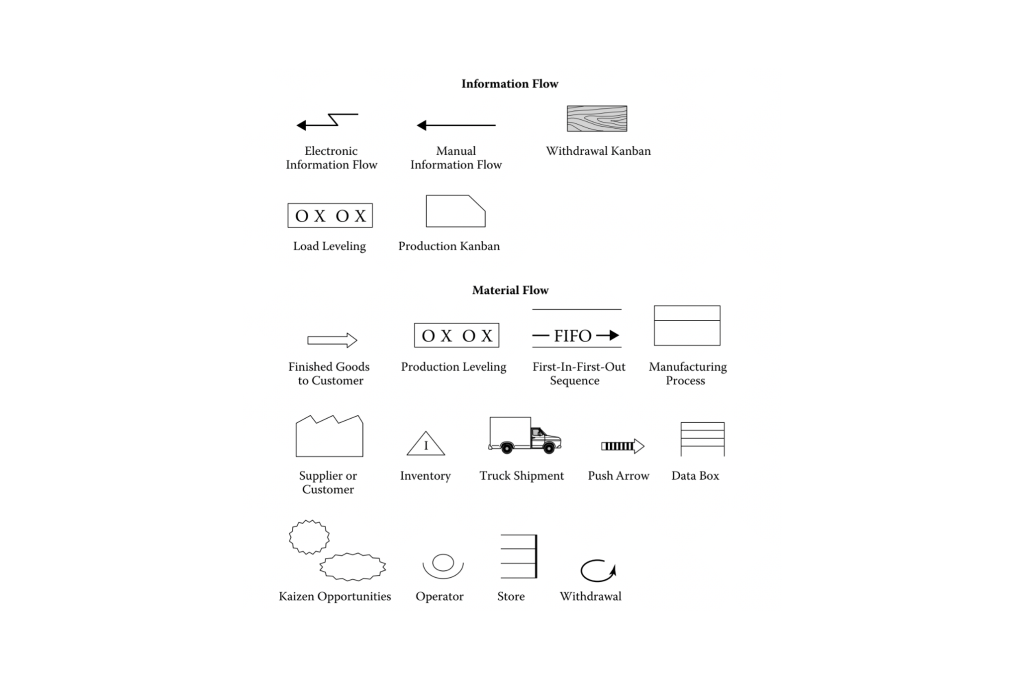
Source: Dennis, P. (2017); Lean Manufacturing Simplified; Value stream mapping symbols.
St. Clair Pallet, a company that makes business pallets, uses these symbols to show how they work. They cut, shape, and put together different kinds of wood.
Currently, the manual scheduling of production is conducted by the production manager for each process, relying on perceived daily priorities. The schedule undergoes frequent changes, represented by the dotted lines. Lead times vary between 12 to 15 days, and approximately 10% of orders are not delivered on time.
Workers are compensated based on the work completed and strive to work as quickly as possible. Assembly cycle times are inconsistent, ranging from 80 to 120 seconds. Inventories are high in both the wood yard and between each process. The time required for equipment changeover is 30 minutes at the multisaw and 20 minutes at the notching machine.
Waiting times at each process are significant due to shortages of small parts, machine downtime, and changeovers. The “spiky clouds” indicate potential areas for improvement (kaizen opportunities) and serve as the foundation for our future-state map
The picture below shows how things are now, called the current-state map. Based on the day’s priority, the production manager plans the work for each step by hand. The plan often changes a lot (shown by dotted lines). It takes 12 to 15 days to finish an order, and about 10% of orders are late.
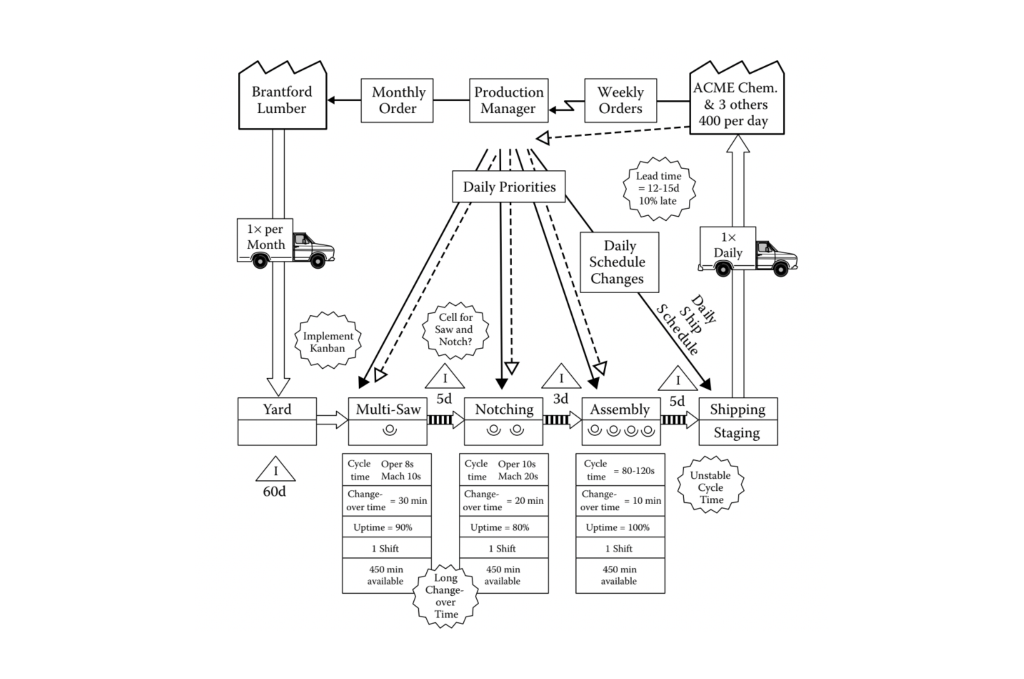
Source: Dennis, P. (2017); Lean Manufacturing Simplified; Current-state map, St. Clair Pallet.
Workers receive payment based on their wages and strive to work quickly. The assembly cycle time fluctuates between 80 and 120 seconds, exhibiting instability. The multi-saw requires a changeover time of 30 minutes, while the notching machine necessitates 20 minutes for the same process.
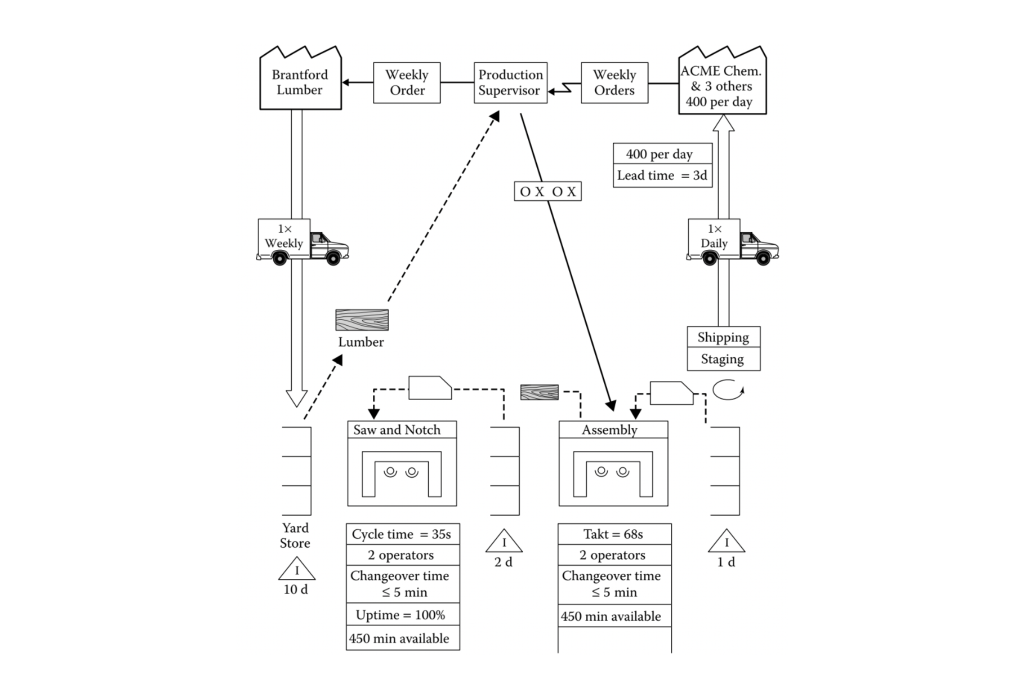
Source: Dennis, P. (2017); Lean Manufacturing Simplified; Future-state map, St. Clair Pallet.
Machine downtime and changeover cause lead times in each process. The “spikes” in the future-state map (shown in the figure above) indicate Kaizen opportunities. Here are some planned improvements:
We need to do several Kaizen activities to support our desired future goals. These activities include:
The main goal of Value Stream Mapping is to find ways to improve processes by visually showing the steps that add value and those that don’t. It involves analyzing each step in the workflow to see how it benefits the customer.
This analysis allows for a thorough examination of processes, giving clear insights into areas that need changes to improve overall efficiency.
Value Stream Mapping offers several significant benefits:
Kanban is a highly dependable tool for Value Stream Mapping. It offers an intuitive user experience and facilitates easy modifications. To begin mapping your Value Stream with Kanban, you only need two essential elements: a Kanban board and Kanban cards for all team tasks. Now, let’s dive into the steps you can follow to start with Kanban Value Stream Mapping.
If you’re new to workflow visualization, start small. Begin with a single team or department. Ensure you select the most convenient method to map out your Kanban workflow—whether it’s a physical board or Kanban software.
Gather the team and communicate the goals of the Value Stream Mapping. Kindly specify your objectives for implementing it.
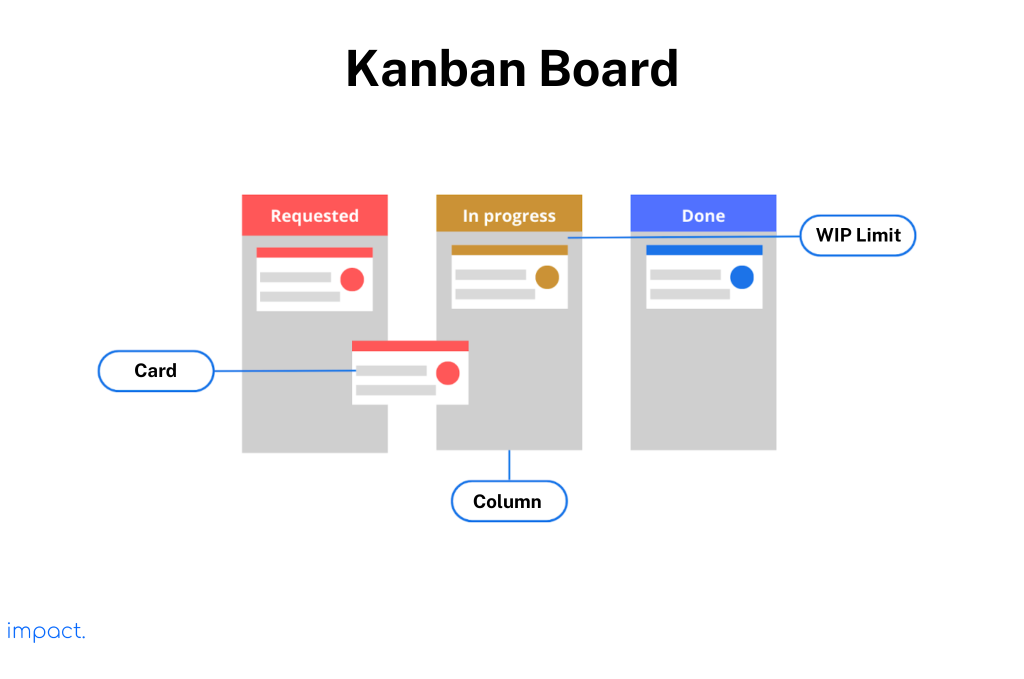
Visualize your process together by default. A Kanban board includes three work item states: Requested, In-progress, and Done. Here’s an example of a Kanban board visualization:
Ensure you select a variety of performance metrics to monitor when implementing streamlined work processes. Some of the essential Key Performance Indicators (KPIs) to consider in your workflow are as follows:
To optimize work efficiency, it is crucial for the lead time and cycle time to align with each other closely.
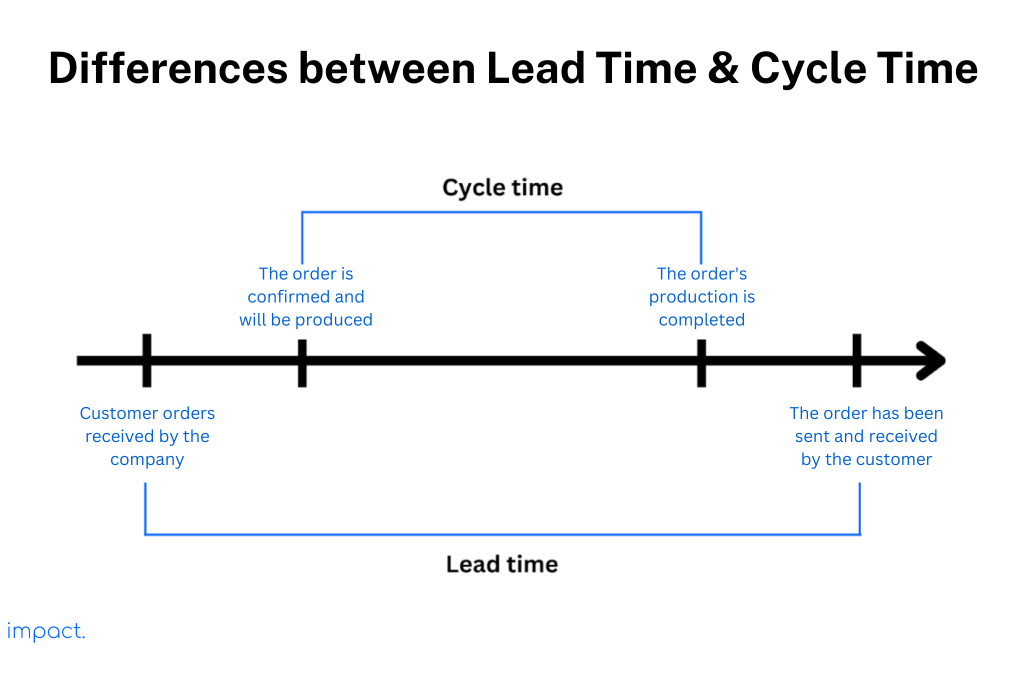
To maximize throughput, prioritize maintaining a high level without compromising the quality of customer value.
Work-in-Progress (WIP) is a crucial indicator in Lean Manufacturing and Kanban. The greater the WIP, the more waiting time will accumulate. Therefore, limit the number of tasks your team can handle simultaneously and adjust workflow data accordingly.
Regularly monitor these key performance indicators (KPIs) and be open to experimenting with the addition or elimination of process steps and advancing your workflow.
Read more: Kanban: Definition, 6 Rules, and its Benefits
Value Stream Mapping is a tool used to help visualize in detail all steps in the work process from supplier to customer. VSM aims to improve operations by visualizing value-adding and waste steps. In its implementation, VSM is closely related to Kanban.
Once you grasp the concept of VSM, the next chapter will focus on Jidoka. Jidoka is another critical element of the House of Lean Production.
Dennis, P. (2017). Lean production simplified: a plain-language guide to the world’s most powerful production system. Crc press.
Impact Insight Team
Impact Insights Team is a group of professionals comprising individuals with expertise and experience in various aspects of business. Together, we are committed to providing in-depth insights and valuable understanding on a variety of business-related topics & industry trends to help companies achieve their goals.
75% of digital transformation projects fail. Take the right first step by choosing a trusted long-term partner.
